
Ever since the end of the 13th century, we’ve used maps to navigate the vast oceans and seas of the world. From circumnavigation to Atlantic crossings, maps have helped sailors chart and travel the world around them. Maps have been – and still are – an invaluable means of collecting, dispersing and utilising information on a maritime journey.
Even though nautical navigation equipment technology has changed immeasurably since then, maps are still our primary means of maritime navigation. Today, we primarily use raster and vector navigational charts to navigate through our nautical journeys. This article will guide you through the differences between each and their individual benefits and pitfalls.
Raster Charts
Raster charts are two-dimensional charts and maps that represent navigational information as a matrix of pixels. If you zoom in far enough on a raster chart, you’ll see the information appear as pixels or small squares, each containing only one colour. Raster images are also known as bitmap images.
Benefits:
- Similar accuracy to paper maritime charts – Raster charts are achieved by scanning and converting physical maps into a digital format, creating a near-perfect representation of the physical map.
- Reliable, true colour copy of physical charts – Raster charts are better for photorealistic representations of information due to high concentration of DPI (dots per image), letting you view physical maps in a scalable, digital format. The original map’s colours, typography, and navigational notes will also appear on the raster chart.
Drawbacks:
- Grainy when over-zoomed – While you can zoom in on a raster chart more easily than trying to magnify a physical map, there is a limit to how much you can zoom before the raster chart begins to look pixelated and grainy.
- No way to hide content – Raster charts exist in a two-dimensional format on a single layer. Therefore, you cannot hide or reveal layers to provide or take away additional information.
- Can’t add information – Once a raster chart has been created, it typically stays as is. There isn’t a way to easily add or remove information from it as it is merely a two-dimensional image.
Vector Charts
Vector charts rely on another method of graphical representation known as the vector file format which is based upon the mathematical principles of coordinate or analytic geometry. This expresses the image as simple geometric primitives rather than pixels.
Benefits:
- Perfectly scalable display – You can zoom into a vector chart as far as you need with no loss of image quality.
- Detailed information – Vector charts let you add various layers of information to your charts, such as separate layers denoting major shipping lanes, positions of buoys, tides at different times of day, and any other pertinent navigational data.
- Ability to filter data – The presence of multiple layers also lets you filter content. You can choose to see any amount of layers at once and hide and reveal layers at will to either simplify or add information to your digital chart.
Drawbacks:
- Potentially different from physical charts – While raster representations are typically scanned copies of physical maps, vector charts are created with specialised vector graphics software. This means there’s a chance the vector-generated image is different from the original chart.
- Inaccurate when over-zoomed – There’s no limit to how far you can zoom in on a vector chart and still see perfect image clarity. Unfortunately, zooming in too far could provide inaccurate measurements and data. If the position of a representative asset, such as a sandbank or buoy, is off by even a millimetre when the vector image is created, zooming in will increase that margin of error considerably, possibly posing a threat to the vessel’s crew.
Should You Use Raster or Vector Charts?
Each method of relaying graphical information has its drawbacks and benefits, and each has its list of appropriate uses.Some users prefer the photorealistic and near-perfect graphical representation of raster charts, whereas others value being able to add different layers of information to a vector chart.
Another idea to keep in mind is how easily you intend to be able to share your charts. Typically, raster charts are easier to share because the most basic imaging display software supports their format. However, for distribution purposes, vector charts are far smaller by comparison. It it also possible to convert raster image representations to vector images and vice versa.
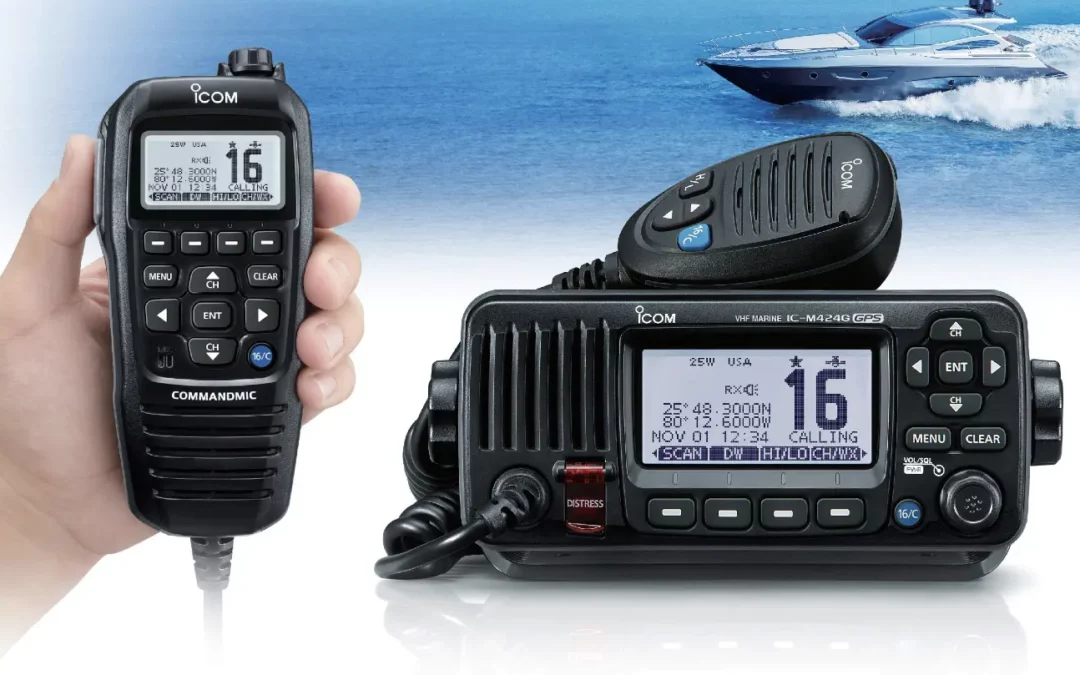
When buying the right marine radar for your vessel, you can also look out for additional communication interfaces such as AIS and NAVTEX interfaces. These can enhance your marine navigation by providing up-to-date information on potential weather conditions and changes.
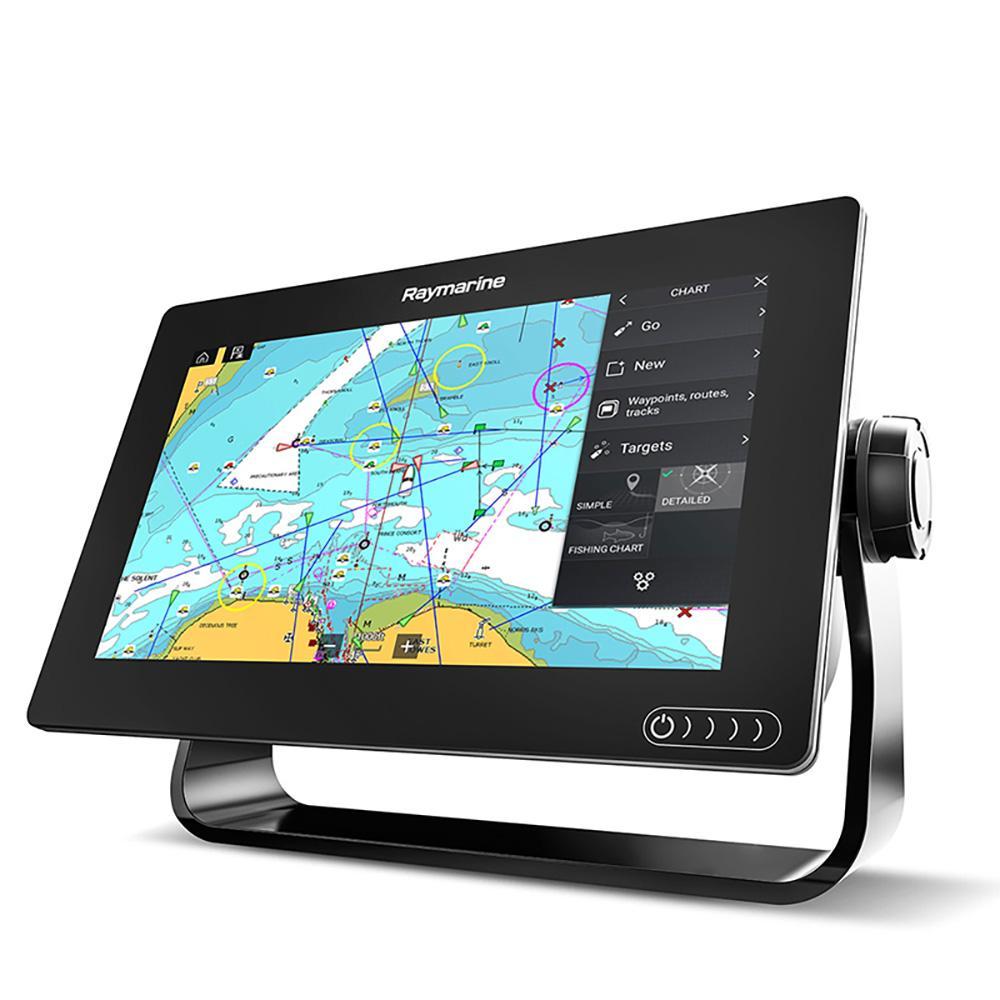
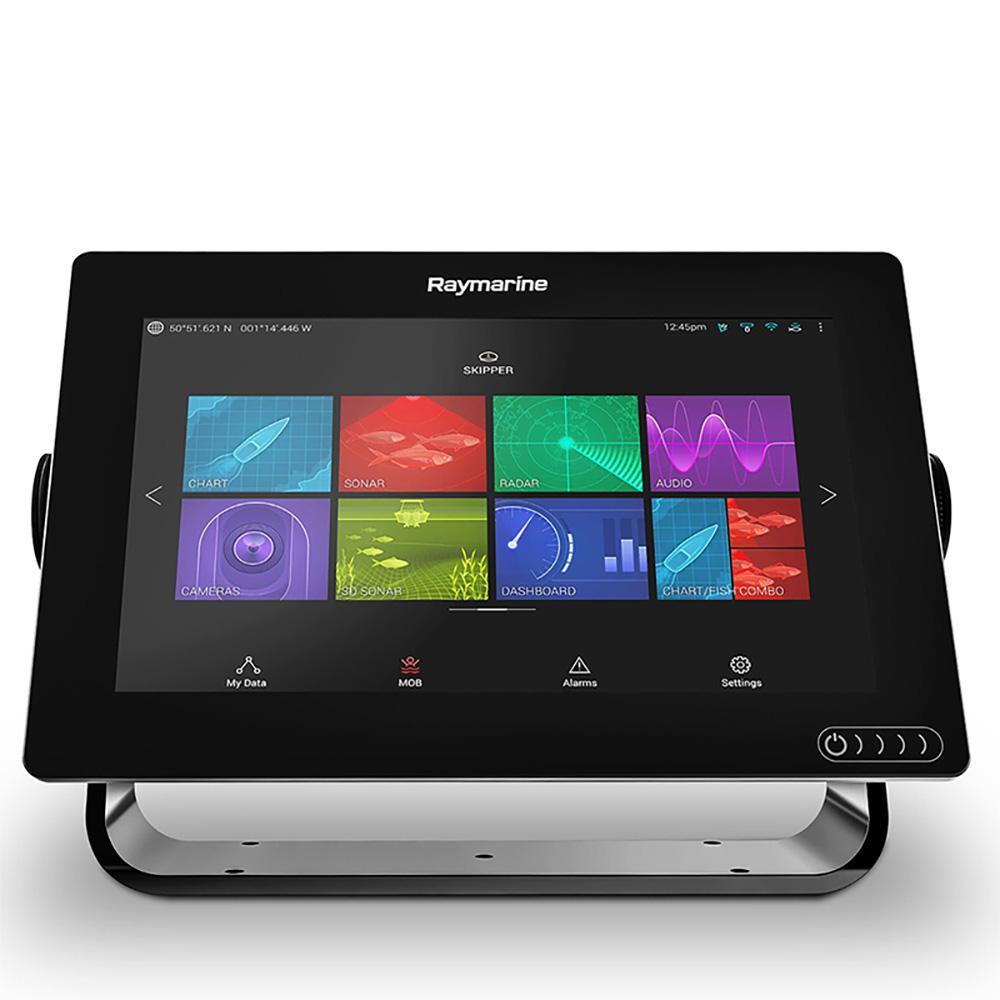
Many multifunction displays available at Tecomart can display both raster and vector charts, allowing you to switch between them as it suits your needs. This includes the Raymarine AXIOM 7 RV (E70365-00) with 7-inch super bright display for all weather conditions, Raymarine AXIOM 12 RV (E70369-00-NSD) with 12-inch display, and Raymarine AXIOM 16 Pro-RVX (E70373-00-NSD) with 16-inch display.
Tecomart has been a trusted navigation and radio communication equipment supplier since 1994, and we believe in furnishing our clientele with only the highest quality affordable marine communication and nautical safety solutions. Get in touch with us today or peruse our FAQs to find out more about how we can help you improve your marine navigation and communication.

0 Comments